Create your own Playlist on MentorMob!
Wednesday, December 12, 2012

Sunday, December 9, 2012
Tuesday, November 27, 2012
Tuesday, November 13, 2012
Fibonacci Haiku #2

Family
Friends
Bonding time
Football game Friday
Saturday spent with loved ones
Then Sunday funday with all of my boys
Fibonacci Haiku #1

Sleep
Dreams
Just wonderful
Sleep is bliss
Warm sheets hug me tightly
They keep me from waking up that morning
Dreams
Just wonderful
Sleep is bliss
Warm sheets hug me tightly
They keep me from waking up that morning
Sunday, November 4, 2012
Thursday, October 18, 2012
Wednesday, October 17, 2012
Tuesday, October 16, 2012
Student Problem #3: Unit I Concept 1

- What is this problem about?
- This problem is an example problem from Unit I Concept 1. It is graphing exponential graphs. We are given an equation and in order to graph a good exponential graph we need a horizontal asymptote, an x-intercept, a y-intercept and key points.
- What must the reader pay close attention to in order not to make a mistake?
- The reader must remember a few important things. To begin with, your "k" is your asymptote. The "a" tells you if your graph will be below or above the asymptote depending is it is negative (below) or positive (above). First, the Exponential YaK Died is an important phrase that helps us remember two things: in exponential graphs, y=k so our asymptote will be horizontal and the domain will have no restrictions, meaning it will be all real numbers. Also, the reader must pay attention to the range. It is dependent on where the asymptote lies. If the graph is negative and it lies below the asymptote, then the range will start with (-infinity, the asymptote value). Or if the graph is positive and it lies above the asymptote, then your range would look like (asymptote value, infinity). *we use parenthesis because 1) infinity........PARENTHESIS! and 2) the graph cannot touch the asymptote. And lastly, your "h" should be your third key point.
Tuesday, October 9, 2012
Student Video #3: Unit H Concept 7
- What is this video about?
- This video goes step-by-step through a problem from Unit H Concept 7 which is finding logs given approximations. We are given three clues and need to find the "treasure" by multiplying or dividing only. We use properties of expanding logs from the previous concept, as well.
- What does the viewer need to pay special attention to in order to understand the concept?
- The reader needs to pay special attention to quotient problems. Everything above the division is positive and everything under is negative. Also, the viewer needs to look to see if the quotient needs to be multiplied in order to get numbers to math the clues.
- It is important to remember to get the hidden clue of log base b of b=1.
Tuesday, October 2, 2012
Thursday, September 27, 2012
Unit G Summary Question #6: Holes
6. How do we find the appropriate place to plot a hole if the y-value is undefined when plugged into the original equation?
 Normally, when we want to find the value of the function we plug in the x value into the original equation and we get a y-value to plot the (x,y) point. However, with holes, we must remember that it is when any common factors cancel out. Therefore, we have a new simplified equation. If we plug in the x value into the original equation, the y-value is undefined. We have to evaluate by using the simplified equation to get the real y-value of the hole. Then, while it is not an actual "real" point of the graph we use an open circle to graph the hole.
Unit G Summary Question #10: Domain and Range
10. While the domain of a rational function depends on DIVAH, what do you think the range of a rational function depends on? Give an example.
The range of a rational function would depend on the y-values. For example, since the domain is the restrictions or "bad values" we can always see those as x-values, or the vertical asymptotes. However if we were to find the range, we would include restrictions on the horizontal asymptote. But, we have to remember, the graph can sometimes cross the horizontal asymptotes, unlike the vertical asymptotes. This would be difficult to find because at times when it crosses then there are no restrictions, there wouldn't be a range.

The domain restrictions on this graph would be 2 and -2. We can clearly see the vertical asymptotes are never crossed. However, the range restriction of 9 is crossed by the middle graph and technically now has no restrictions since it was crossed.
Unit G Summary Question #4: Vertican asymptotes v. holes
4. What is the difference between a graph having a vertical asymptote and a graph having a hole?
The vertical asymptote and the hole fall into the same category because we factor the polynomials to find the vertical asymptotes and see if anything cancels. That is where the holes come in; they are the common factors in the numerator and denominator. They both go hand in hand because you have to make sure you use the simplified equation to find the vertical asymptotes, the domain, the x-intercept, and the y-intercept. However, the difference in finding the points is that for vertical asymptotes we are setting the simplfied bottom to 0 and that is our x= equation. For the holes, out "equation" is just a point (x,y) and we plug in the x value into the function and get the value.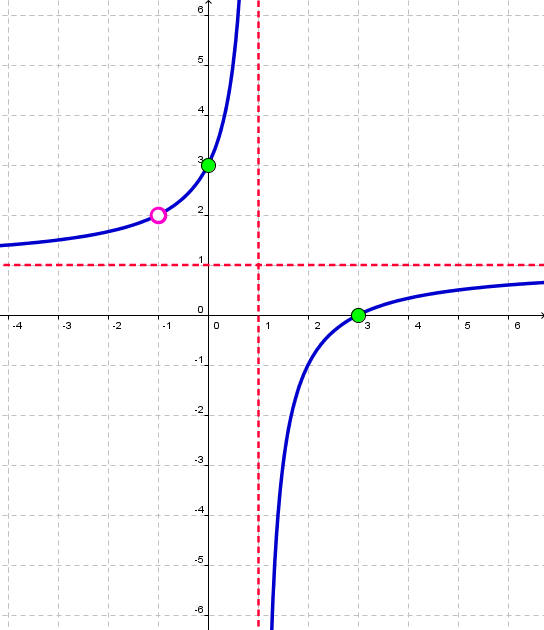
Wednesday, September 26, 2012
Unit G Summary Question #9: X-intercepts of a rational function
9. Describe how to find the x-intercepts of a rational function. Include both the long way and the shortcut way, explaining why the shortcut makes mathematical sense.

Tuesday, September 25, 2012
Unit G Summary Question #8: Y-intercept of rational function
8. How do you find the y-intercept of a rational function? Does this need to be done in the original or simplified equation?

To find the y-intercept of a rational function, you replace x with 0. We remember this by saying Y-INTERCEPT......X=0! When we replace x with zero, we simplify both the top and bottom. Then, we will most likely get a number that looks like a fraction. Simplify and then right your point as (0,#). It is important to note that this needs to be done in the simplified equation. Also, if your y-intercept is a hole, it is important to note that it is not real. To check if your point is correct, you can use your graphing calculator and trace x=0.
Unit G Summary Question #7: Limit Notation for Vertical Asymptotes
7. Describe how to write limit notation for vertical asymptotes and what the notation means.
To write limit notation for vertical asymptotes, there are two parts for each asymptote. Since your equation is x=___. It is going to be a vertical line. Therefore, there can be something happening with the graph to the right and somethings happening with the graph to the left. So, for each vertical asymptote you must write the equation As x approaches the (vertical asymptote) to the RIGHT(+), f(x) approaches (either -∞ or ∞). AND As x approaches the (vertical asymptote) to the LEFT(-), f(x) approaches (either -∞ or ∞). The-∞ means that the graph is going down and the +∞ means that the graph is going up. How do we know if it goes up ordown, you may ask? Well, you need to plug the whole equation into y= in your calculator. USING PARENTHESIS!

The vertical lines represent the asymptotes and you can clearly see, for example, As x approaches -1+, f(x) approaches ∞. And as x approaches -1-, f(x) approaches -∞
Unit G Summary Question #5: Crossing Asymptotes
5. Describe the conditions in which a graph can cross through an asymptote.

Unit G Summary Question #2: Horizontal Asymptote Limit Notation
2. Describe what limit notation for horizontal asymptotes actually means.
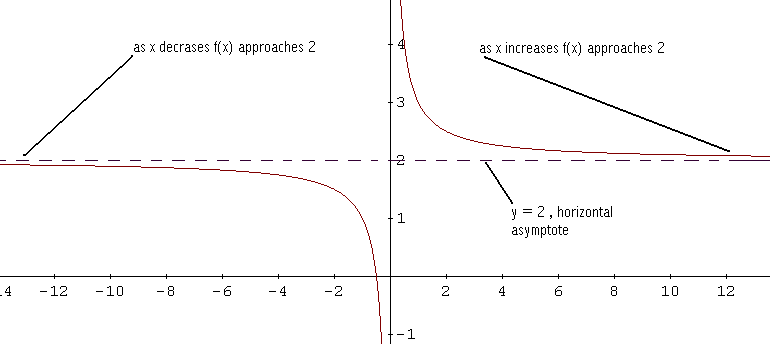
Limit notation for horizontal asymptotes states that as x approaches infinity, f(x) approaches a # and as x approaches negative infinity, f(x) approaches a #. This is basically saying: As we go to the right, the graph gets closer to this number and as we go to the left, the graph gets closer to that number. Normally, the number we use, we get from the horizontal asymptotes y= equation. Also, the number is normally the same for both going to the right and to the left. This is because the horizontal asymptote is continuing in a straight horizontal line.
The limit notation for this would be: as x approaches infinity, f(x) approaches 1. And as x approaches negative infinity, f(x) approaches 1.
Sunday, September 23, 2012
Unit G Summary Question #3: Slant Asymptotes
3. When does a graph have a slant asymptote? How do you find the equation of the slant asymptote?
A graph has a slant asymptote if the degree on the top is one bigger than the degree on bottom. To find the slant asymptote you use long division. Your equation is everything except the remainder. To remember this, we remember this song: A slant one! A slant one! Degree must be one bigger on top. A slant one! A slant one! Long divison will tell you where it's at. The equation is y=mx+b. Just like horizontal asymptotes, the graphs can sometimes cross through the slant asymptote towards but never towards the right.
Unit G Summary Question #1: Horizontal Asymptotes
1. How do we know if a graph has a horizontal asymptote? What are the three options?
We know if a graph has a horizontal asymptote by comparing the degrees of the numerator and denominator. There are three options for the horizontal asymptotes. If the bigger degree is on bottom the asymptote is y=0. If they have the same degree, the asymptote is the ratio of the coefficients. If the bigger degree is on top, there is no horizontal asymptote. Also, since it is a horizontal asymptote the equation is y=___. In addition, the graphs can sometimes cross towards the middle of a horizontal asymptotes but never the far left or right.
STUDENT VIDEO #1: Unit F Concept 10
- What is this video about?
- This video goes step by step through a problem from Unit F Concept 10 which is finding all zeroes of a polynomial (both real and imaginary zeroes). The problem I chose was #8 from the "concept 6 and 10 extra practice" from the SSS packet. This video reviews the previous concepts in Unit F including: rational roots theorem, Descartes rule of signs, and synthetic division.
- What does the viewer need to pay special attention to in order to understand the concept?
- One thing the viewer needs to pay attention to looking at how many possible positive and negative real zeroes you may have. This way, you know what numbers to try for synthetic division.
- Also, to look for any GCF's in the quadratic. It is important you make sure to include the GCF in the factorization, too.
Subscribe to:
Posts (Atom)